|
Advertisement / Annons: |
Tutorial:
|
Content: |
1: IntroductionIn my earlier tutorial about cameras time efficiency ../tutorial-camera-time-efficiency/tutorial-camera-time-efficiency.html it could be interesting to know how many photons we receive every second per pixel with the used equipment. Here I will show how it can be done with help of Fitswork. You can do similar in your own software probably. If you have not used Fitswork earlier you can get an introduction here from my tutorial: ../tutorial-fitswork/tutorial-fitswork.html.
|
2: Load a raw file into FitsworkBefore loading your raw file into Fitswork, check the setting: 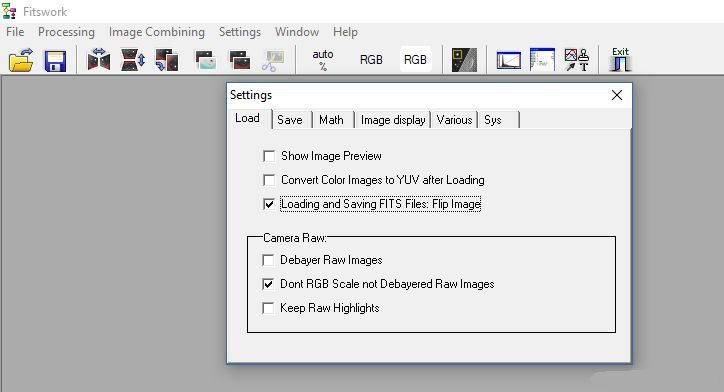
If it looks like this it will work. 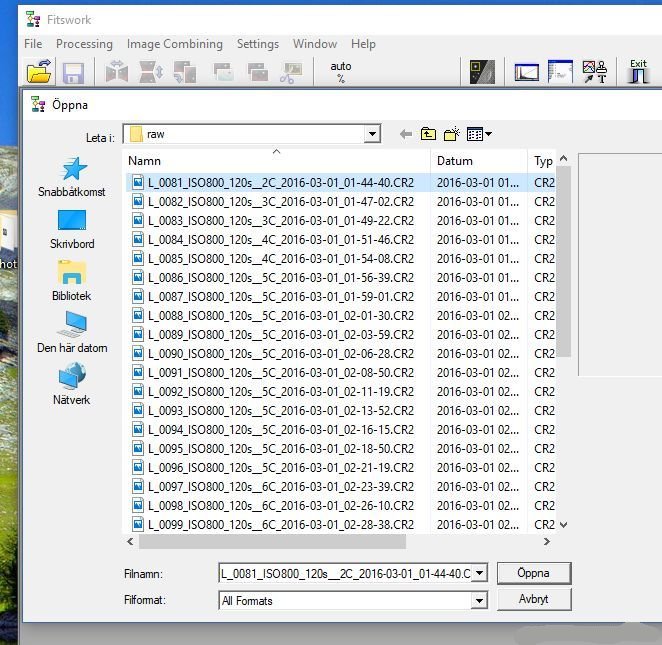
Open file, search in your archive for a high quality image raw file, not too long exposure length, 30 to 120 second, to not have too much dark current. 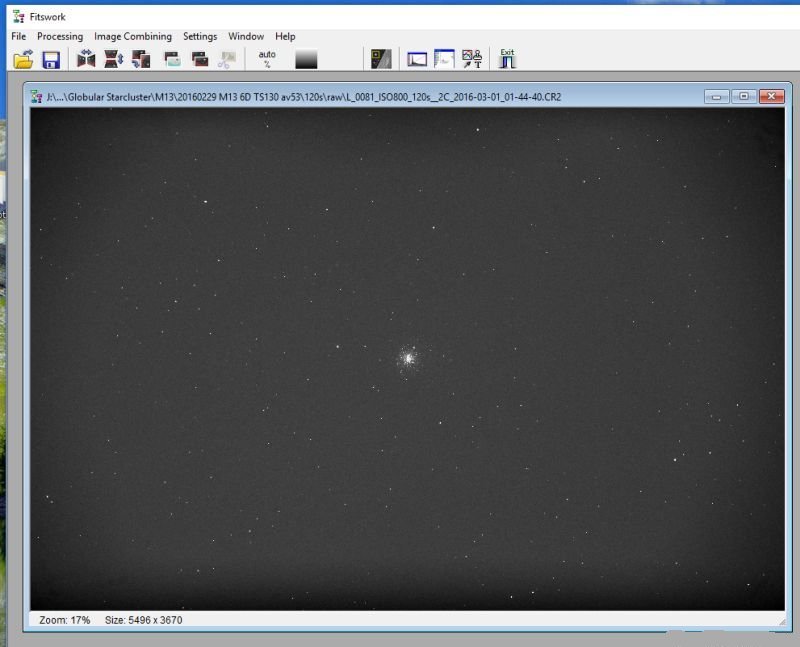
Here how it could look, it's not converted to color yet, it's in CFA file format. A DSLR color cameras raw file. Fitswork has already subtracted a constant, 2048 that correspond to the bias so you don't have to worry about that in this software.
|
3: Transform CFA image to colorIf the image come from a mono chrome camera you will never do a debayer process to get it in color. 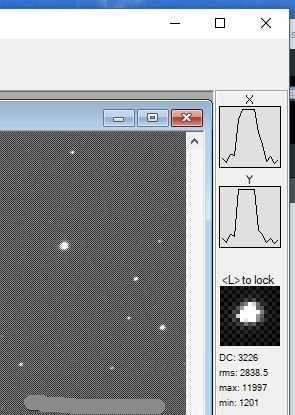
Move the mouse curser over stars and look to the right on the Fitswork window where you have the profile (must be enabled) of the object (star), you will immediately see if it's oversaturated or clipped. The flat top show it's clipped. This time we only wanted to see the green wave length. We have to debayer the image to bring out the color channels. The levels will not be very accurate after a debayer process, but in this case we need to separate the color channels. It's much better if the software can demosaic the color channel direct without use of debayer. I do that in AstroImageJ, but it's a bit too complicated to explain here. 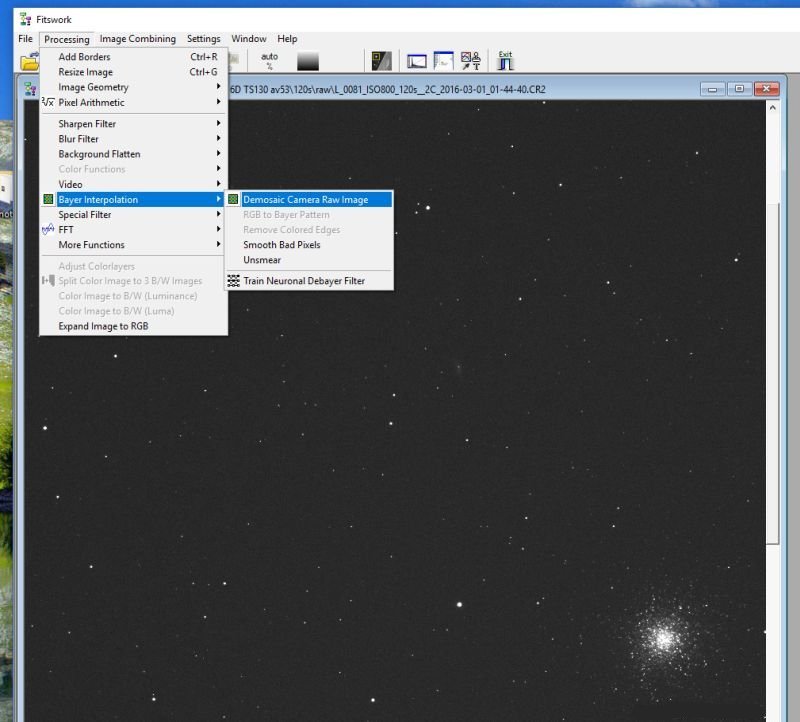
Open the debayer window, this is a German software, the English can be a bit strange sometimes as my English are too. 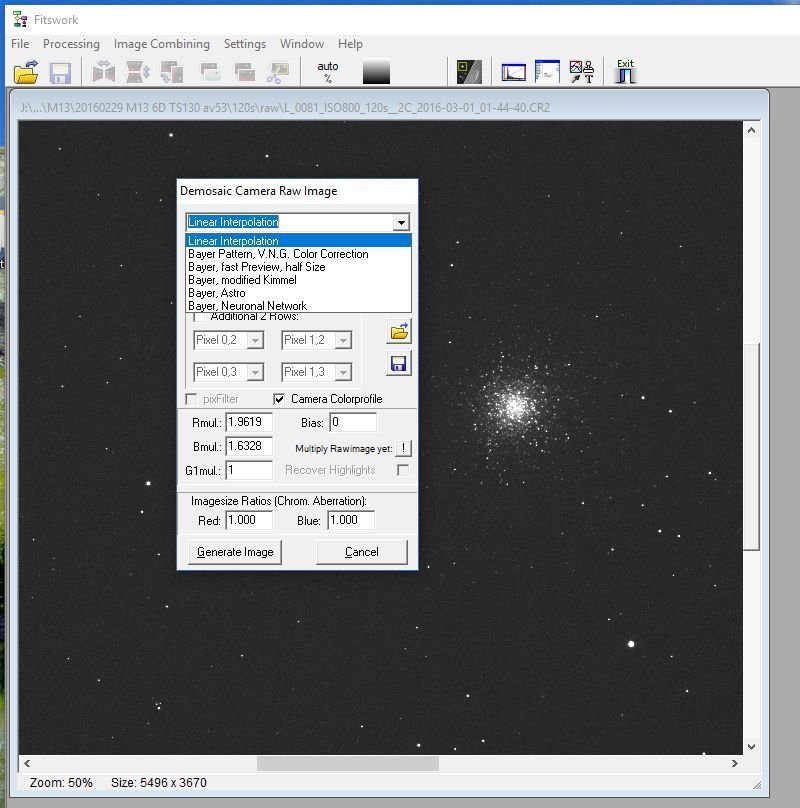
To get the color levels to be as correct as possible, use the linear interpolation process. 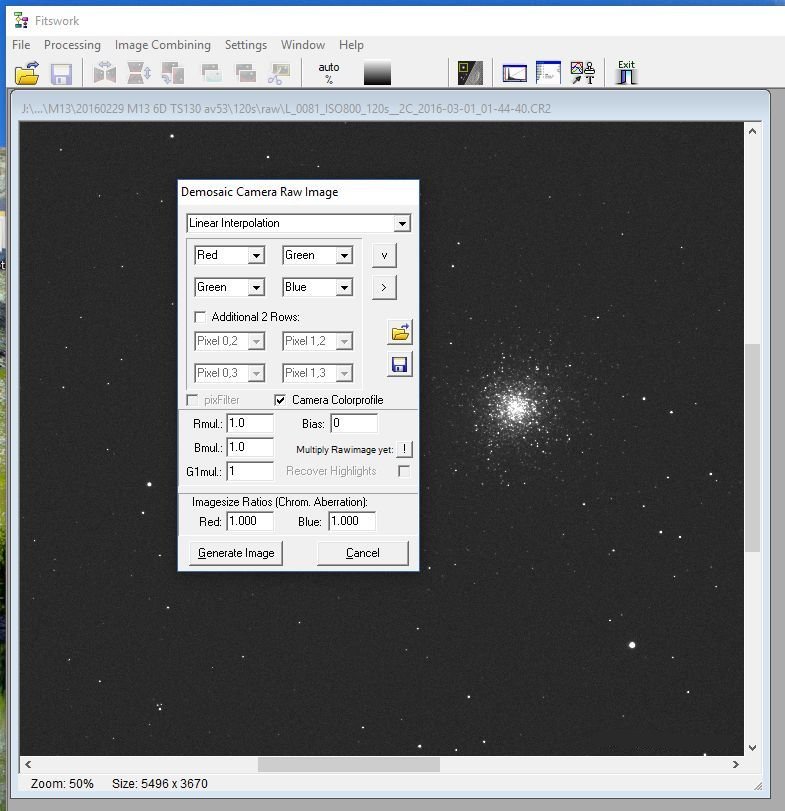
Set Rmul (Red multiplier) and Bmul to = 1, uncheck the Camera Color profile. 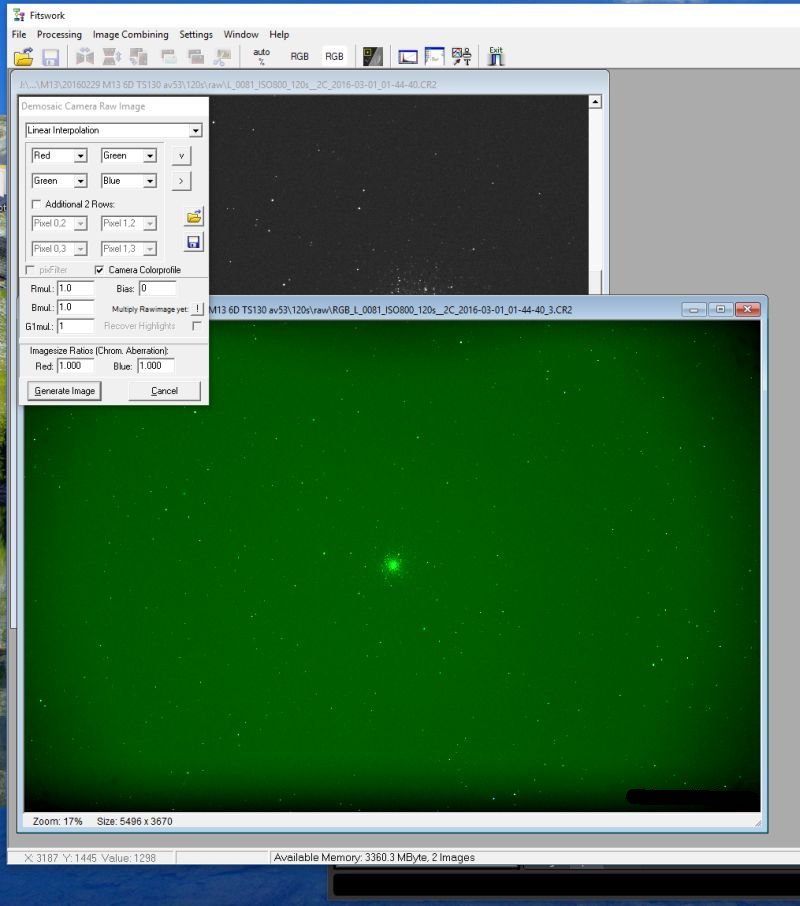
Click "Generate Image". If it looks correct close the debayer window by cancel button.
|
4: Find a good starNow we are ready to find a star that's good enough for us to calculate the peak photon flow on. It must be in the center of image were there is no vignetting. It shall have an empty area close to it were we can get the background from. Move the mouse over the stars and look to the right in Fitswork window for the stars profile as we did above. Normally we have most light pollution in the red wave lengths, but the camera is most sensitive in the green wavelength so it will dominate. Many stars will have the green wave length saturated before red and blue channel because of that. Find a candidate star that has it peak at about 50% of max value, for a 14 bit camera that is about 6000 ADU. 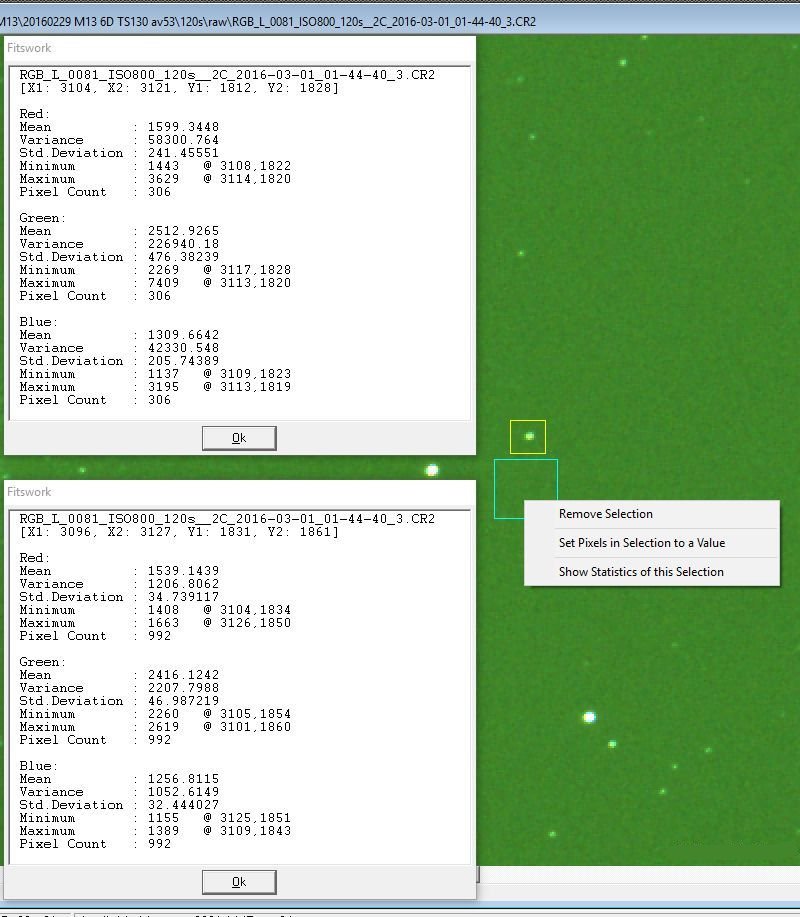
When you find it, draw a rectangle around the star with the mouse, hold the left button down from first corner and then drag the mouse until the rectangle is around the star, then release the button. Right click and choose "Show Statistics of this Selection", a new window opens. Make a new rectangle close to the first where there is no stars. That will be our background area. Open the statistic window for that one too. Look at the statistic for the star and green wavelength. We see that the peak has the value 7409 ADN / pixel. The background in the other window has the mean value 2416 ADN / pixel. We now can calculate the peak flow from the star in ADN. Subtract the background from the star, 7409 - 2416 = 4993 ADN / pixel. Now we have to transform this to ADN per second. We know this is a 120 seconds exposure, divide 4993 / 120 = 41.6 ADN / pixel / second. 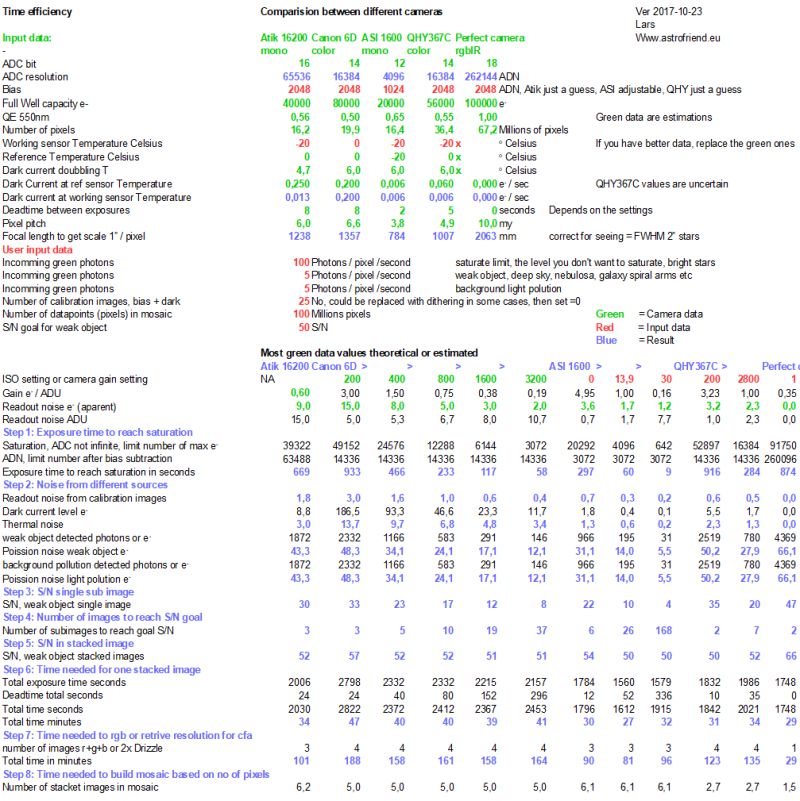
Next step, calculate how many photons this ADN correspond to. The Canon 6D has a gain of 0.75 e- / ADU at ISO 800. We also know it has a QE of 0.5 at green wavelength, or how big share of our incoming photons that will be detected. That give 41.6 * 0.75 / 0.5 = 62 photons / pixel /second. I have a very high light pollution and that takes a big portion of the available dynamic range. The head room are about 10000 ADN, it means our star above will saturate after about 160 seconds. Our weak object photon flow will normally be something hidden deep under the noise floor in a sub image.
Note:
|
5: At what magnitude will the sensor clip the star?If we can identify the star we did the measure on we can get it's magnitude. Easiest way to identify stars on the image is to let some software do a plate solve of the image. Here I use the web based Astrometry.net http://nova.astrometry.net/ and upload the image after I had prepared it, crop it and set the black and white level. 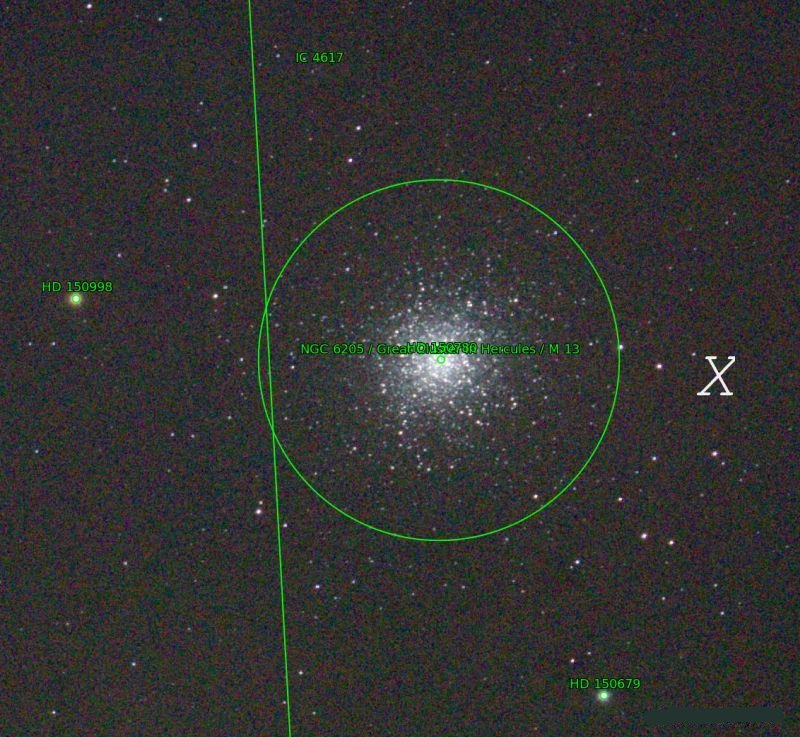
I got this answer back with annotation on it, it didn't identify the star, the one marked with a X, maybe too many stars when we come to this low magnitude stars.
One step down on the magnitude scale correspond to an increase of the flow of photons by 2.512. Now we only measure the peak, to measure the magnitude you need all photons we detected, not just the central pixel, maybe ten or more pixels around central peak. But roughly speaking, a peak with 2.5 higher levels should correspond to one-step magnitude change.
|
| Go Back |