|
Advertisement / Annons: |
Project:
|
Content:
Note: |
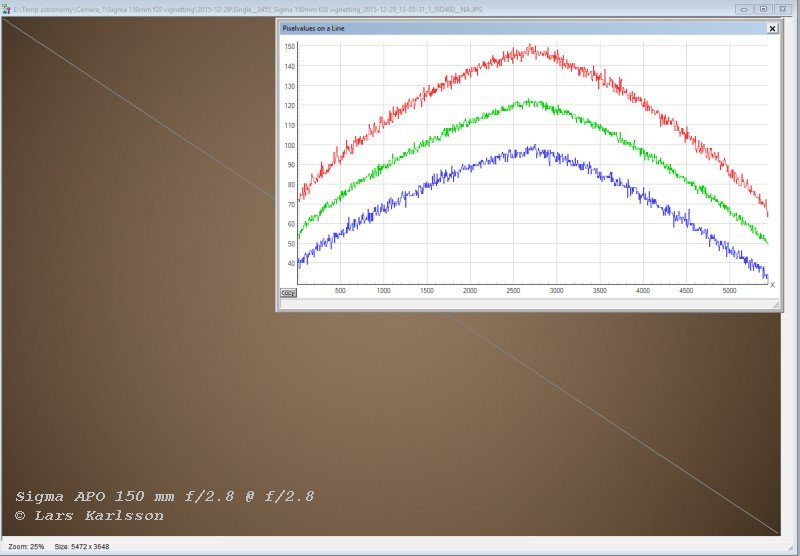
3. Analyze of Sigma APO 150 mm f/2.8 vignettingThese two images are taken from a color RGB flat. 
This is the Sigma APO 150 mm f/2.8 lens. Aperture set to f/2.8, fully open. The line from one corner to the opposite is where the figures come from at the X-axis in the graph, it has the unit pixel. The Y-axis is the signal along this line. Ideally it should have been a flat line when the lens is light up even from a white paper. But it's not a flat line because the lens is vignetting. The signal strength drops from center to the corners. Look at the green line close to center, the signal is about 120 at this point. Most left and most right side of the line are two of the corners of the sensor. The green line has fallen to 50 here. 50/120 = 0.41 or 41%, that is very much. My goal is to have at least 70% of the center signal level in the corners. 
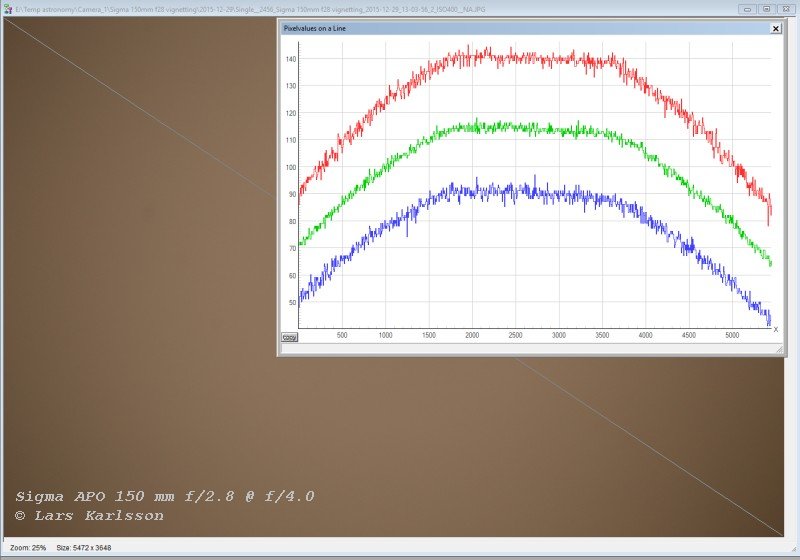
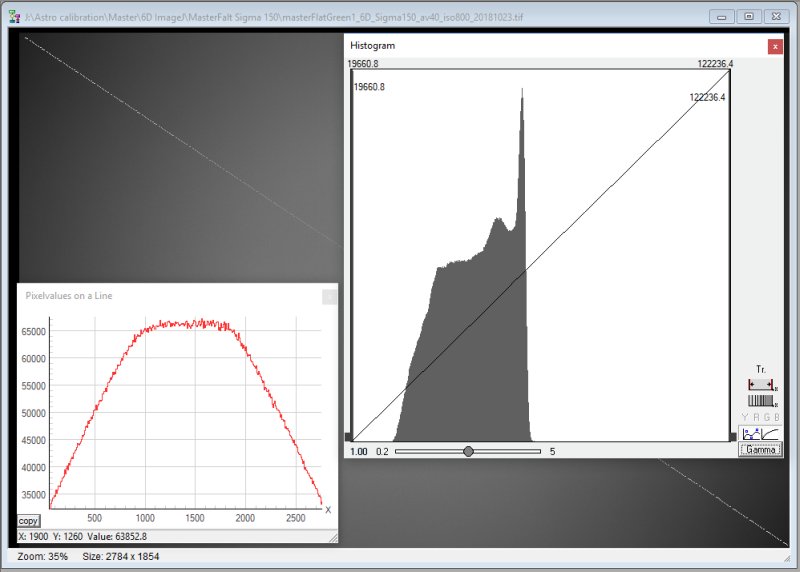
When the lens aperture is set to f/4 it looks better, that's normal. If we do the same calculation once again with the new figures we get 70/115 = 0.6 or 60%. Still a bit high but usable. If you have 50% you can see it like that you only have half the exposure at the corner and then the Signal / Noise is reduced. Flat calibration don't do anything about the S/N, when it adjust the signal level it also increase the noise. We of course want to have the same S/N quality all over the field, that's why it's to prefer a low vignetting lens. As a comparison with my new Master flat where I demosaic the RGB image, this is the green 1 channel. 
This flat is of higher quality. These figures say 33000 / 65000 = 0.507 or 51%. It's a bit worse then the example above, but this Master flat is much more trusty. If you use this lens with a camera that has a APS-C sensor the vignetting will be much less, you only use the center of the field. The sharp peak on the right side in the histogram comes from the flat top in center of the line graph, many pixels with the same value. As a whole this histogram is much wider then the histogram at top of this page from the Pentax lens because it has much more vignetting. The scale of X-axis in the histogram is not correct. These flats has been normalized to 1 in center and it's a 32-bit floating point file. Fitswork does something wrong when opening these kind of files, it looks that it multiply the level by 65000 (2^16). It doesn't matter, all calculation will be correct anyway.
|
|