|
Advertisement / Annons: |
Project:
|
Content:
Note: |
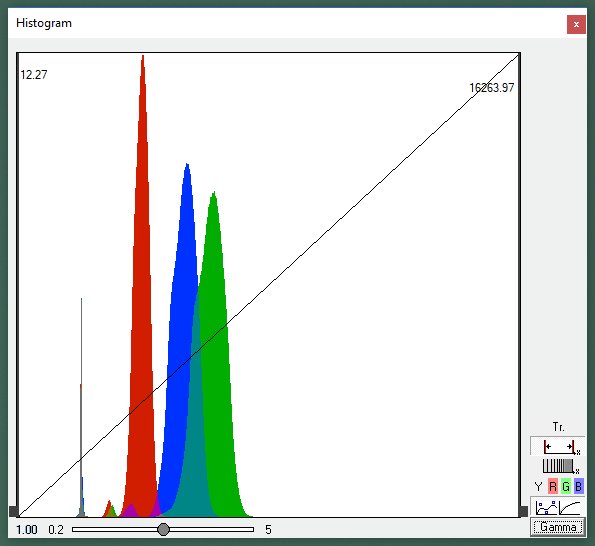
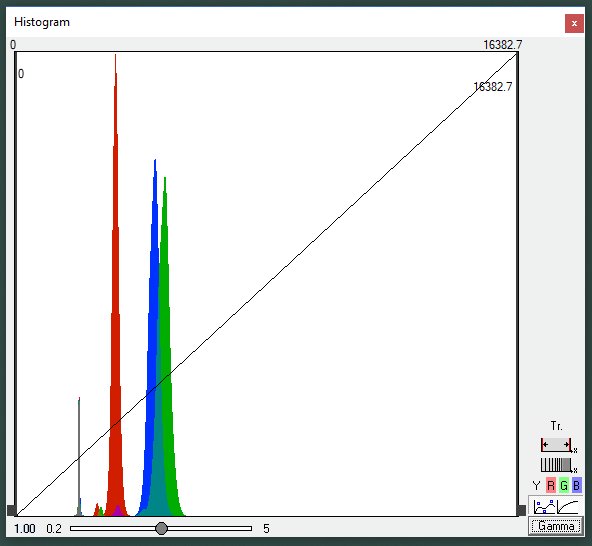
2. Histogram and vignettingYou can already in the histogram see how bad or good the vignetting is of your system, compare these two histograms. They are taken from the CFA file and no bias subtraction has been done yet. It's like a raw file in TIFF format. It is an evenly illuminated white screen that is photographed. In the perfect world all pixels should have the same signal. These two histograms have been done in the Fitswork tool. 
This histogram comes from the Pentax medium format lens with aperture set to f/2.8, fully open. The X-axis scale runs from 0 to 16000, that is the range of the 14-bit ADC that a normal modern DSLR camera has. 
The same lens but now with aperture set to f/4.0. A normal lens vignett less when reducing the opening. Note how much more narrow the peaks are compare to when aperture is set to f/2.8. Note: You must have the peaks at the same position on the X-axis to compare this. Narrow and high peaks means that more pixels get the same signal. And that is exactly what this histogram says, narrow peaks less vignetting. The very narrow grey peak to the left is the bias, in this camera it has a value of 2048, the spread we see in the bottom of it is because of a small difference between ADCs and some noise, static and random, there many ADCs in a CMOS sensor. I'm not sure how they add the bias, could be as simple as an analog reference signal before the ADC.
Note about taking flats: The color balance, each color should have almost the same signal (level) if the QE is the same for each color. In reality it's not the case, the light source is not perfect white and pixels of different color are not of equal sensitivity because of different wavelengths. In a perfect situation all three colors should line up on top of each other. If the color balance is bad, one color with high signal can be over saturated and another color with low signal can be noisy. Sometimes I use a tinted paper, often pink to cover the lens with, pink color reduce the green light. When you take flats you should try to have them at half of the max signal. But in a heavily vignetting system these peaks can be very broad and then the signal must be lower to not oversaturate part of the peak, the right side in the histogram. The above flat images could take advantages of more exposure, maybe twice as much. This is a linear histogram in X-axis, in most DSLR cameras the histogram is logarithmic. To get a histogram to look like this you have to place the signal of the strongest color in the DSLR camera's histogram window all the way to the right but not over the edge. You must use the color histogram to see that none of the colors oversaturate. Then there are sensors that are not linear, they compress the signal at high level, not good for an astro camera. Then lower the signal in the flats so that they don't reach the level were this compression starts. Here I have written more about flat calibration:
It was problem with the monitor to have an even light from it, nowadays I mostly do it with the T-shirt trick or a tinted paper to get the colors in balance.
|
|