|
Advertisement / Annons: |
Astronomy Science data |
Content: |
V, Position of nearby stars:Preparing the data set for position data:I use the same data set as I used earlier.
This data's purpose is to see if the position of stars makes groups in different angles or if they are totally random. They are chosen to be in the neighbour of our Sun. A parallax of 0.05 arcsec is the same as a distance of 20 parsec or 65 Ly (Light years). These data include 703 stars or maybe some other objects. Gaia archive:Below is the page / link to start from: 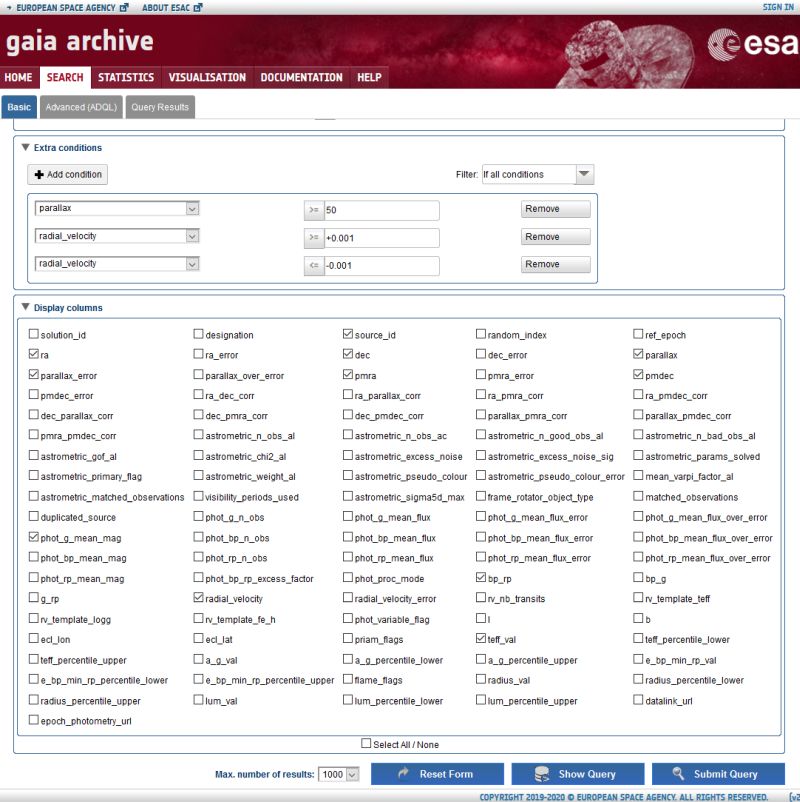
I have already the RA and DEC data in the selected data and can use it directly. I use the earlier stored CSV file. |
Octave histogram of the position of the nearest stars: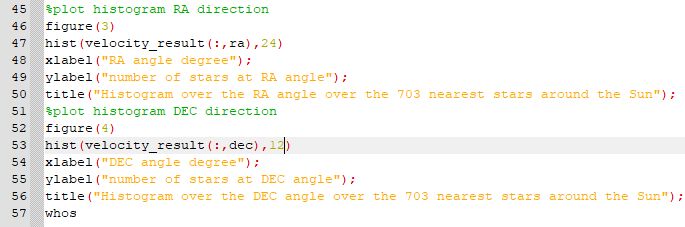
I have added two histogram plots in the macro, one for the RA and one for DEC.
The class width is 15 degrees. 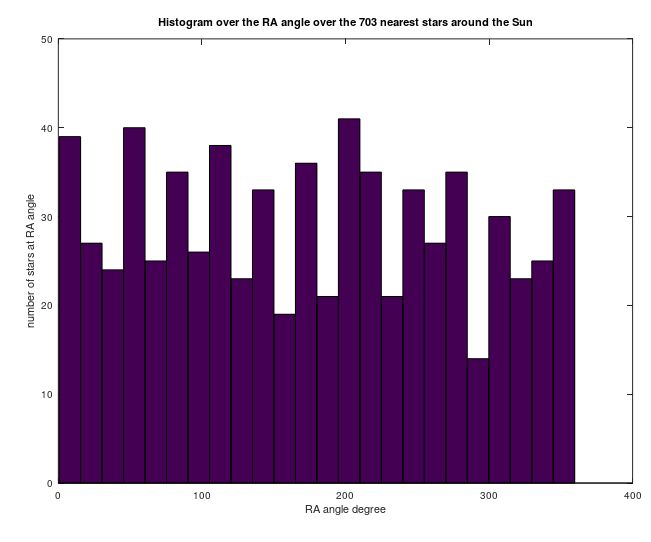
This graph shows how many stars in each group of 15 degree widthin the RA plane. It has a drop at the interval 285 to 300 degree direction. 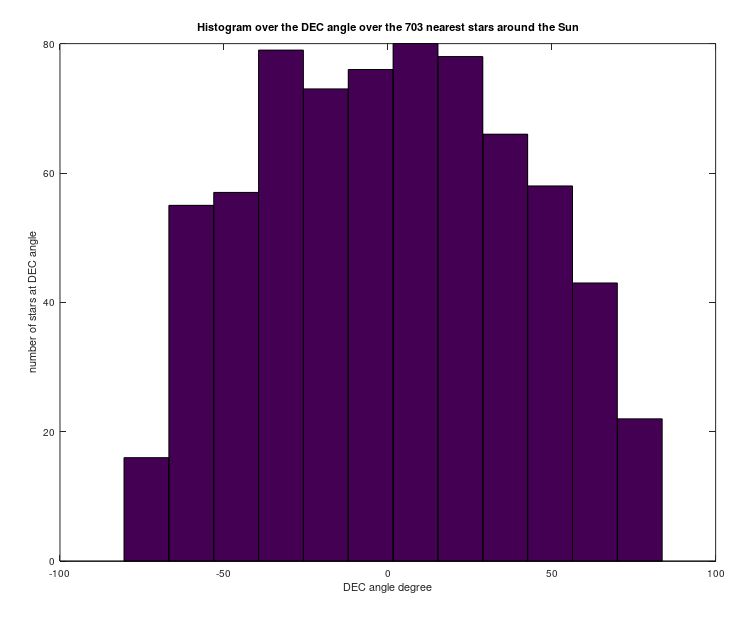
As above but for the the DEC plane. The RA is tilted 27 degree relative our Milky Way galaxy plane. Most of the stars in our galaxy is placed along the galaxy plane. Because of the construction of the RA/DEC coordinate system the length of RA is less at the +/- 90 degree compare to the equator. In this simple graph it means less area and less number of stars per area unit. You can order the data from the Gaia archive in another form to have equal areas. You find more information about galactic plane at Wikipedia:
Maybe we could get a better overview with a 3D plot, let us try. 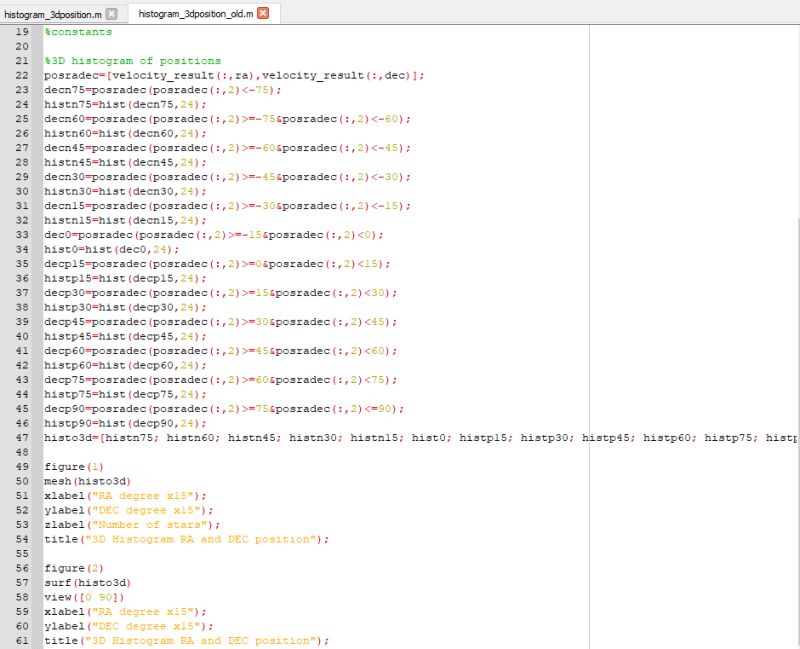
This is the macro I setup to do this, I will rewrite it in a more elegant and easier to use macro later. I have sliced up the DEC data in 15 degrees interval. 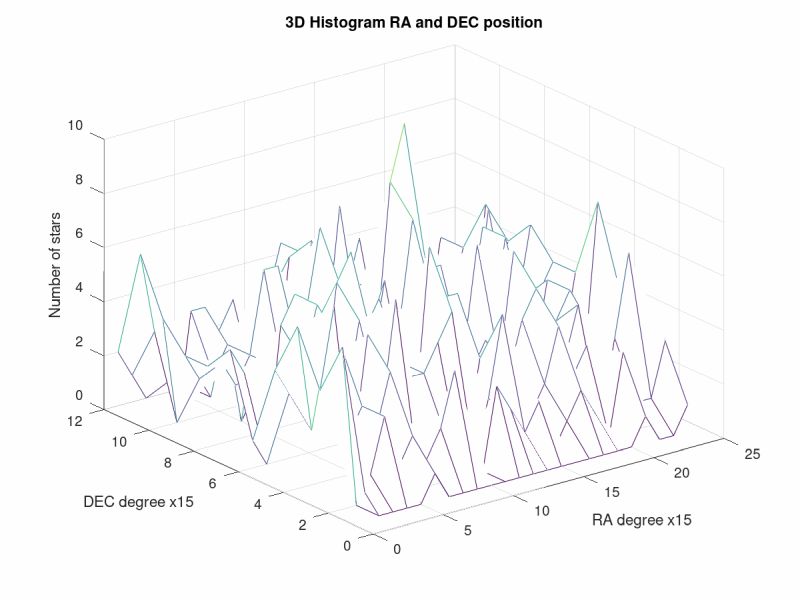
From this you can see the population of stars around our star. The data is in the form of a 12x24 matrix, each ceil is a 15x15 degree block in RA, DEC. The histogram are along the the RA-axis and slices of DEC-axis, the DEC-axis is -90 to +90 degree, you have to recalculate. 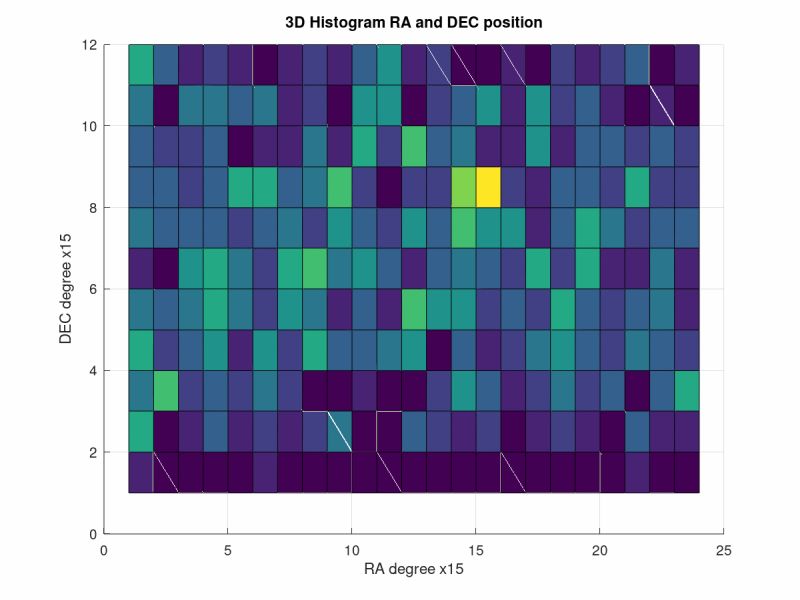
An alternative is to plot it as a surface where the color correspond to the number of stars at each position. But to few stars to be good statistics. If we increase the radius from our Sun where we pickup stars we get more of them. With twice the radius we get 8 times more stars if they are equally distributed (2*2*2, because radius is one dimension and volume is 3 dimensional). |
New histogram plot, now all stars up to 10 mas parallax radius: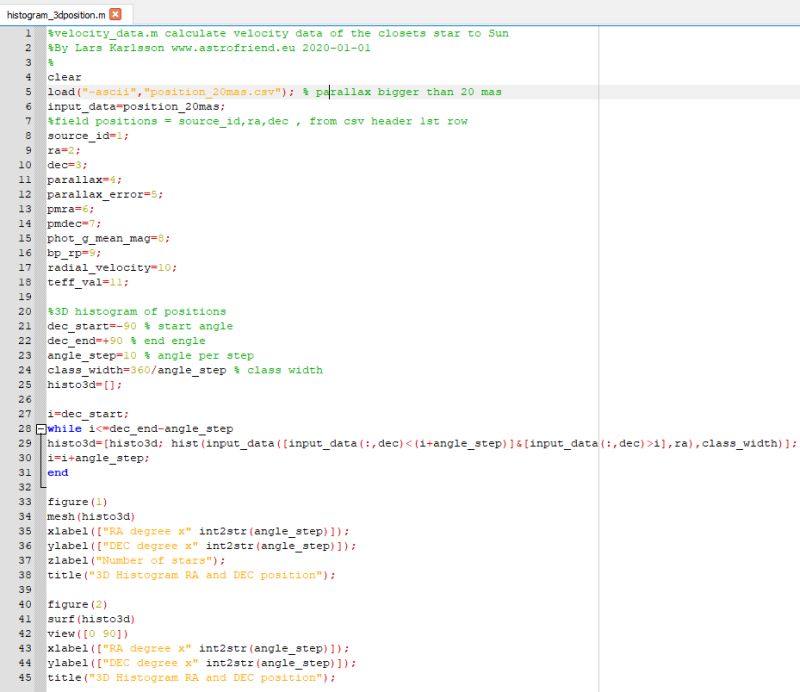
After rewritten the old macro I got this. I have a while loop that do the slicing of DEC data. It could be even more compact if I use vectors but then more difficult to follow and understand. With this I easily can change the parameters, even the title of the graph adapts to new data. I have uploaded new data from Gaia, I decrease the parallax from 50 mas to 20 mas (longer distance) and got 10'000+ stars to work with. 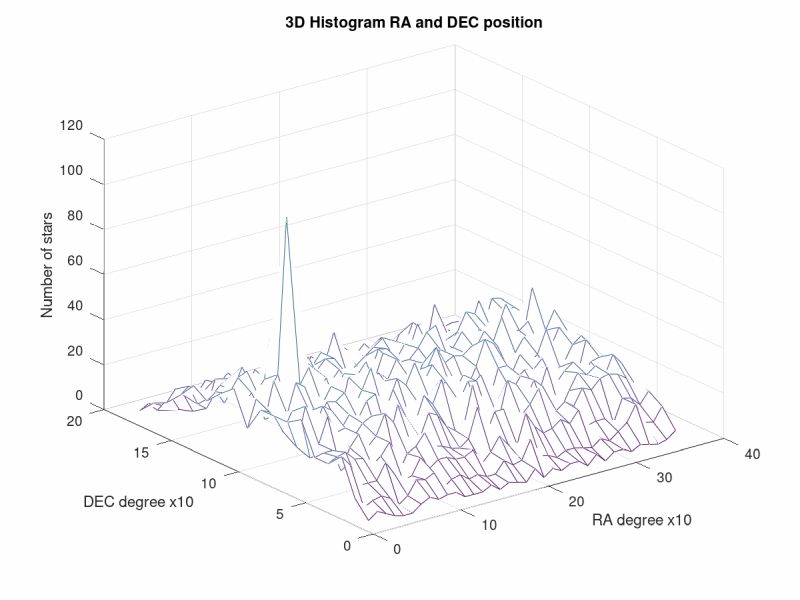
The ceil resolution is now a 5x5 degree block. Because of more stars now the "noise" is lower. A strange peak at one position with about 60 stars appear. 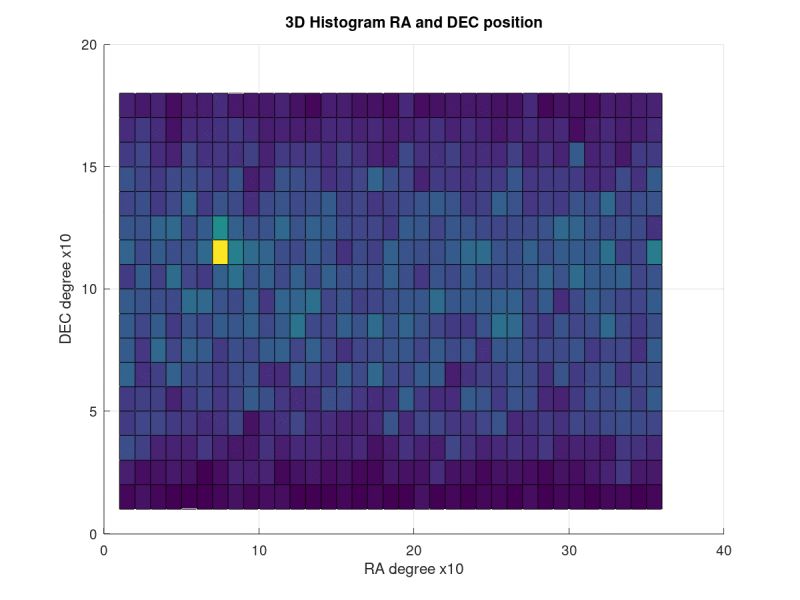
With a radius of 20 mas (0.02 arcsec = 50 Parsec) we now have a sphere with a radius of 163 light years. It hold more than 10'000 of the nearest stars. The yellow dot are the position where a lot of stars collect. I don't know why yet. |
Some useful links with information:
One limitation in Gaia data is that no bright stars are included. Gaia is optimized to detect weak stars and all star visible to the naked eye over saturate the CCD sensor and not usable. |
|
Credit:
Gaia Collaboration et al. (2016): Description of the Gaia mission (spacecraft, instruments, survey and measurement principles, and operations). |
| Go Back to content |
| Go Back |