|
Advertisement / Annons: |
Astronomy Science data |
Content: |
III, Hertzsprung-Russell diagram from star data:Prepare the data set to have better statistics:Now I want more stars to get a better statistic. I also demand the objects to have an absolute radial velocity not equal to zero. The objects in the data base without a radial velocity looks to be other objects than stars or weird data.
This data purpose is to make a HR-diagram from the nearby stars to our Sun. A parallax of 0.1 arcsec is the same as a distance of 10 parsec or 32.4 Ly (Light years). Gaia archive:Below is the page / link to start from: 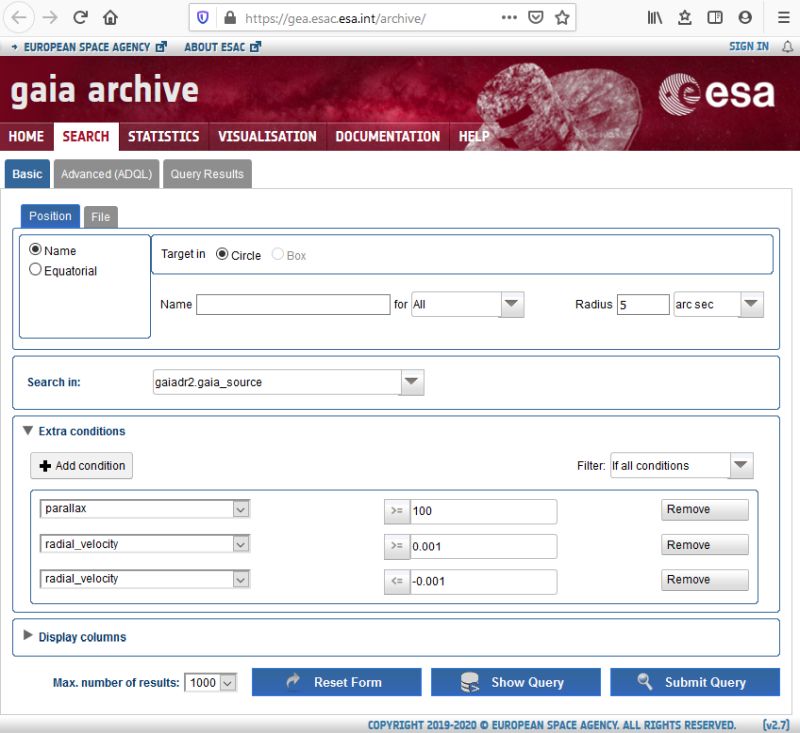
I setup the conditions like this, but as you see the radial speed is an AND demand, it must be an OR demand. I have to do the query direct in the query window. click "Show Query". 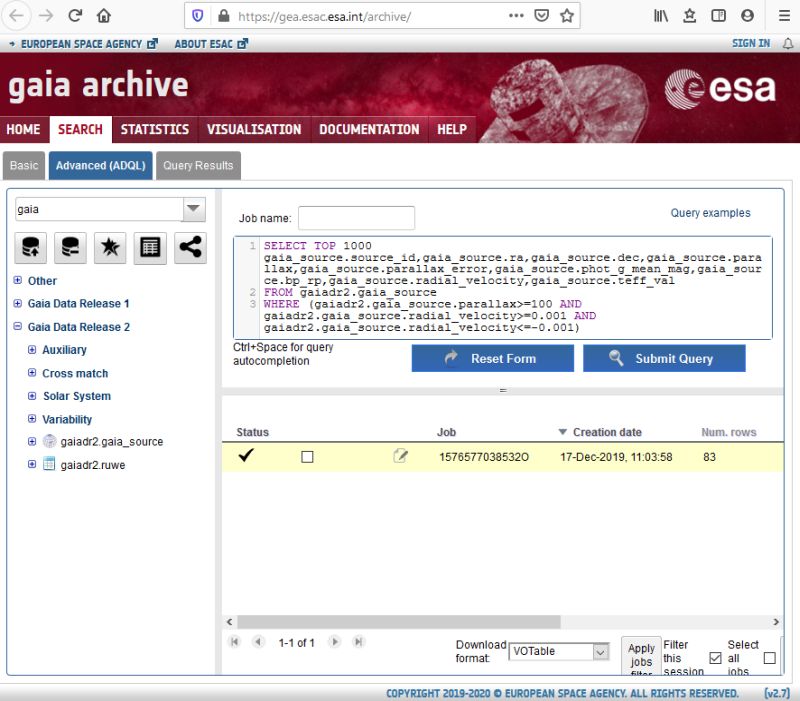
The two last lines you have the query about the radial velocity, that must be changed. I think these queries follow the SQL standard, I have not use that language very much, have to improvise. 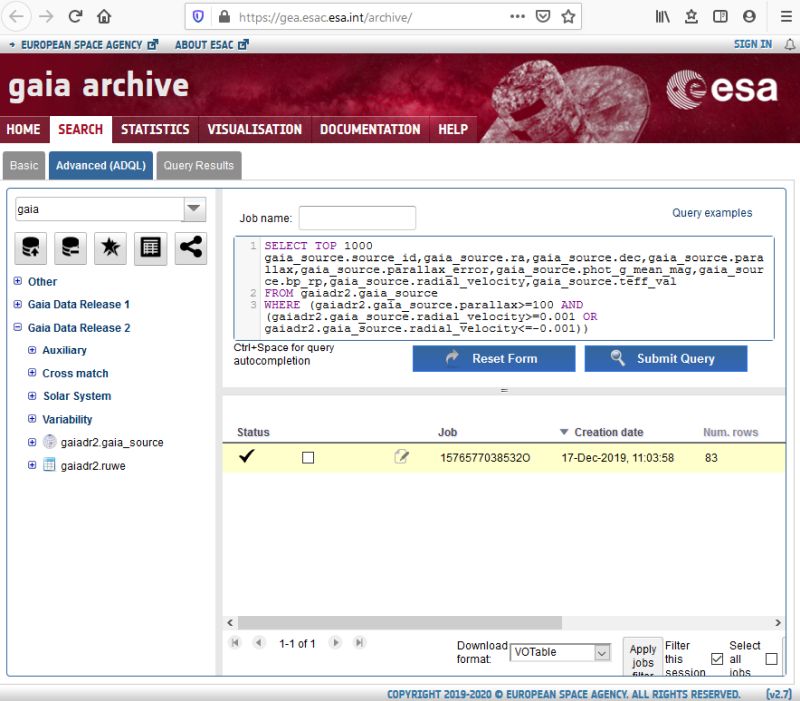
I set the two last lines between two parentheses and changed the AND to OR. I submit the query and got 84 objects (stars), too few, changed the parallax from 100 milli arcsec to 50 milli arcsec. That's a radius of 64 parsec around our Sun's barycenter. Now I got 703 objects in the list, that's ok, don't forget to increase the max numbers from 500 to 1000. |
Open office (Excel) Hertzsprung-Russel diagram:Now the fun starts, these first graphs will only be 2 dimensional and then I can do the calculation in Open Office Calc. Note: You can do data graphs in the Gaia page also, but for the moment I prefer to do it in my own spreadsheet, I get more control of what I do. 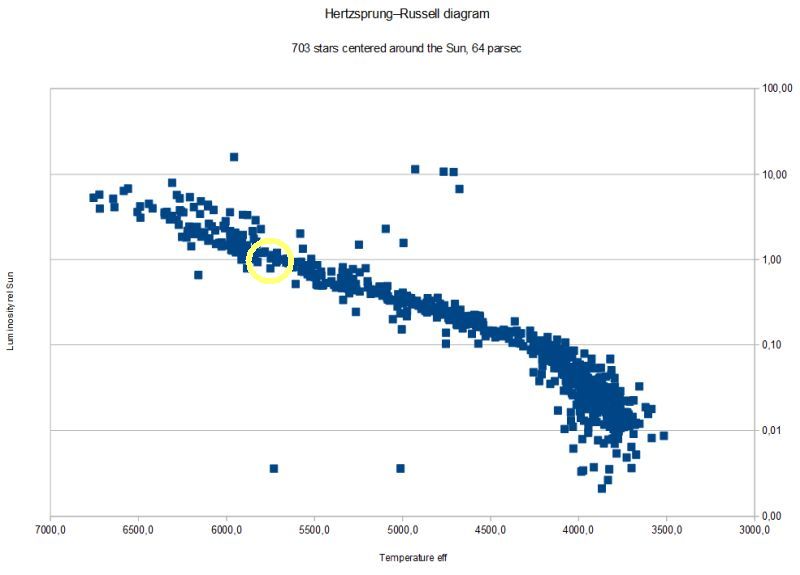
First diagram I calculate and plot is a Hertzsprung-Russel diagram. Above the mainstream you find the giants, below the mainstream you find the white dwarfs. If all stars that I selected has the same origin as our Sun you can follow their development in the diagram. Stars born to the bottom right, then follow the mainstream up to right, later up to the giants at right, end as white dwarf at bottom. But which of the stars has the same origin as our Sun ? Hard to say, our Sun is 5 billion years old and has done about 20 revolutions around the galaxy, a lot has happened to the orbits of the stars during this time. The yellow ring symbolize where our Sun belong in the HR-diagram. It took our Sun 5 billion years to reach this point, half its lifetime is spent. More information about Hertzsprung-Russel diagram at Wikipedia:
To draw a diagram like this you need, the stars effective temperature, the distance in parsec, and the absolute magnitude. All these data you can get from the Gaia data we selected, but needs some recalculations.
Note that the magnitude in the Gaia data is not exactly the visual magnitude, it's more the sum of the blue and red filter data and called green mag. 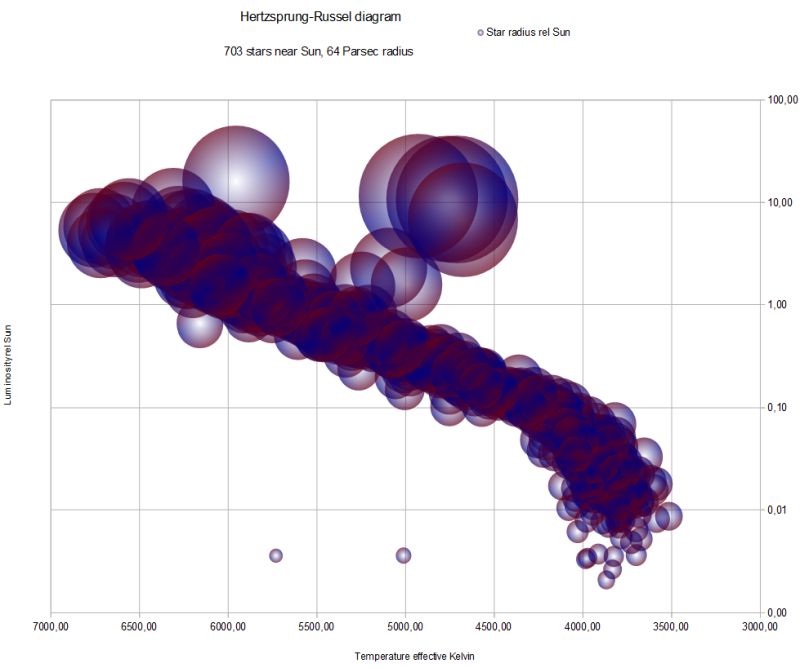
Even more data can be displayed in the HR diagram, the stars radius. We can calculate the radius from the luminosity and temperature. Now it's very clear which stars are the giants. A small star must be much hotter to have the same luminosity as a big star, from that we can calculate the diameter of the stars. To draw a diagram like this you need, the stars effective temperature, the distance in parsec, and the absolute magnitude. All these data you can get from the data we selected, but some needs further calculations.
The a is Boltzman's const. and the S index relate to Sun. In the software Open Office Calc I use this diagram, it is called bubble diagram. It takes a lot of power from the computer to calculate it like this with shaded diameters. More information about Absolute magnitude at Wikipedia:
|
Octave:My plan is to use something like Matlab when I want to do more complicated math. Matlab I used at the University but it's very expensive to own as a private person. Octave is a similar math tool and it's free. You can download it from here: More information about Octave: 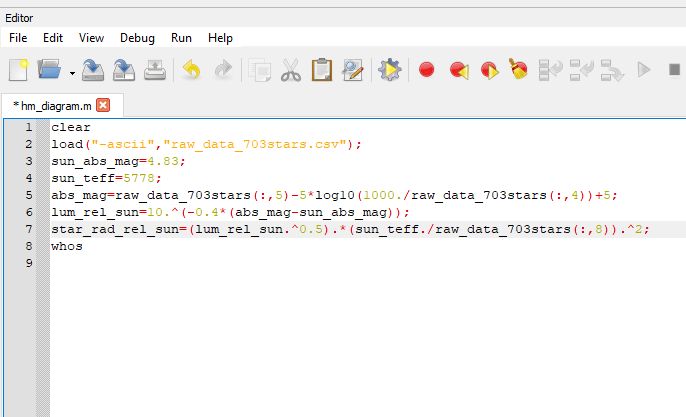
Setup a equation in Octave is a bit different compare to Excel. This is an example of the equation I used in Excel to calculate the needed data for a HM-Diagram. It's a macro written in the internal editor, but you can use Notepad as well. In this case the Excel or Open Office is better to use. 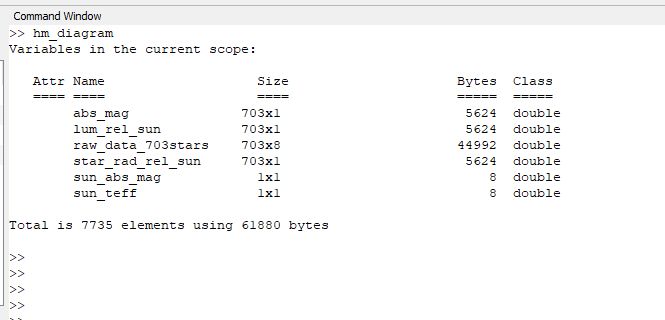
After run the macro in the command window we get this result. Data we can use to draw a HM-Diagram. |
Some useful links with information:
One limitation in Gaia data is that no bright stars are included. Gaia is optimized to detect weak stars and all star visible to the naked eye over saturate the CCD sensor and not usable. |
|
Credit:
Gaia Collaboration et al. (2016): Description of the Gaia mission (spacecraft, instruments, survey and measurement principles, and operations). |
| Go Back to content |
| Go Back |