|
Advertisement / Annons: |
Astronomy Science Data
|

|
| Coordinates/Direction : | RA: 290.427033o, DEC: +43.624771o. Angle calculator |
| Object size : | sensor about 1 x 1 degrees |
| Object magnitude : | - |
| Object : | Area of Cygnus, Lyra and Draco |
| Date : | 2009-08-19 to 2013-04-08 |
| Lens/telescope : | Kepler Space observatory |
| Film/CCD : | Sensor position 41 (from sensor 41, 42, 43, 44), Kepler data, credits: STScI |
| Filter/Wavelength : | 420 to 900 nm |
| Exp. time : | 27 minutes x 44 frames |
| Image process tool : | Fits viewer NASA, AstroImageJ, Fitswork, Irfanview |
| Processing : | Flat calibrated, GIF movie |
| Site : | Space |
| Comment : |
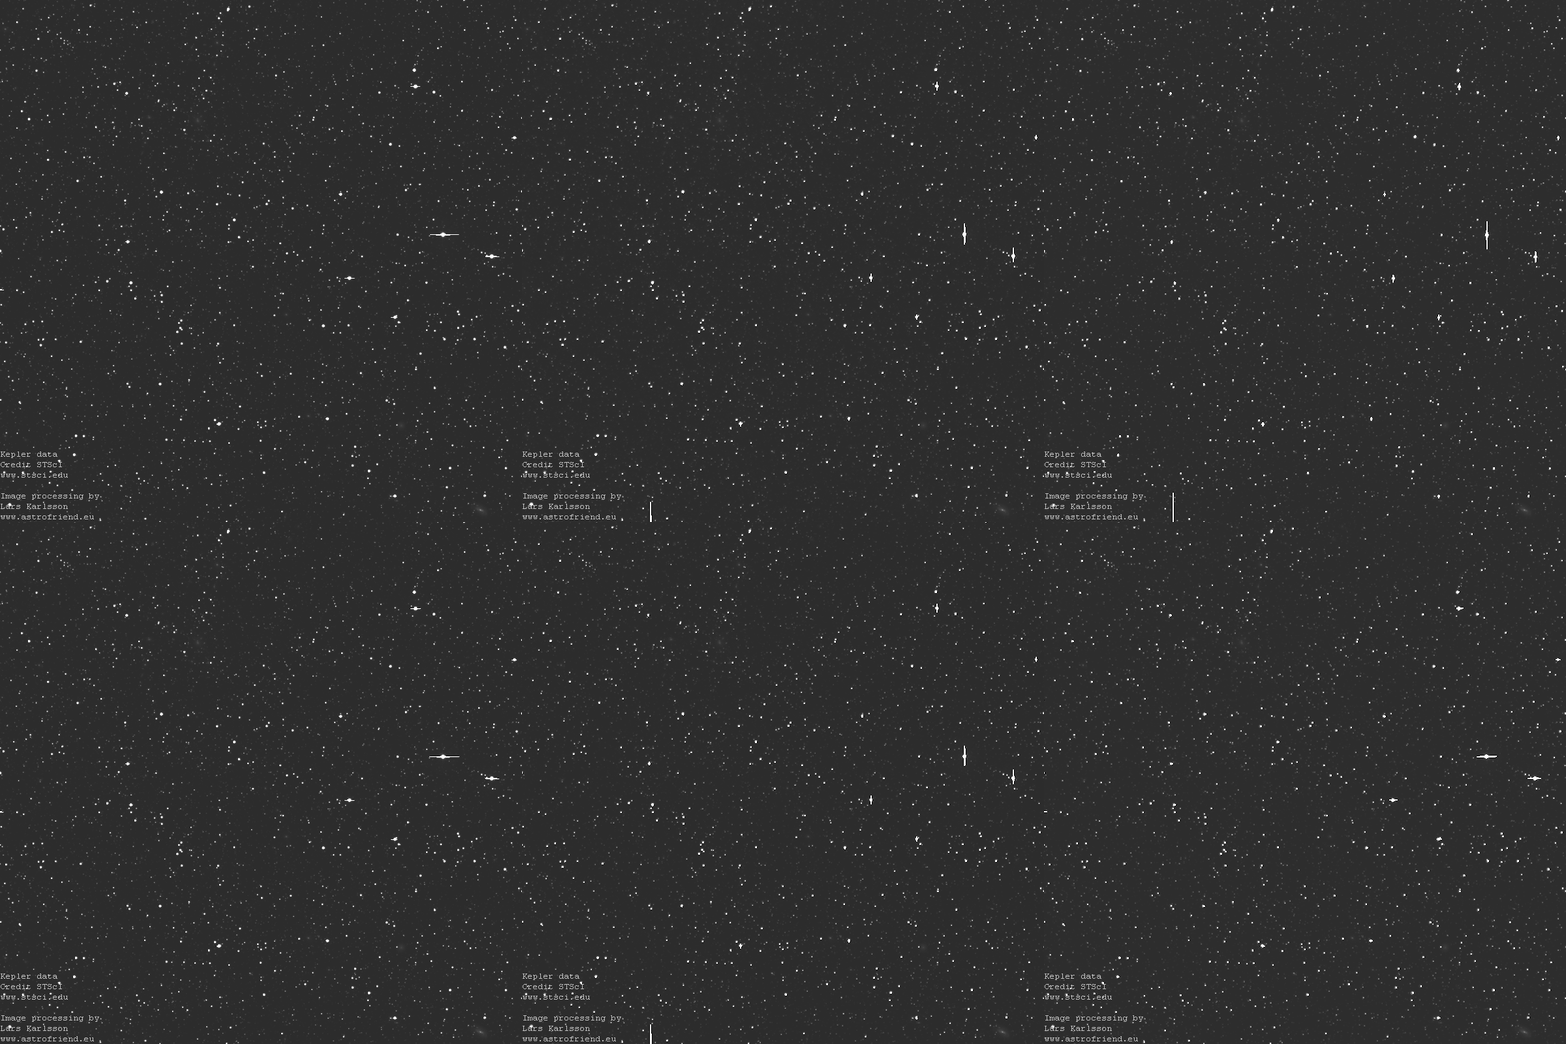
This is my first attempt to examine variables, each frame from one month and there are 44 of them ranging over almost four year.
You will clearly see one variable. Later I can tell you which it is.
Hans Bengtsson at Astronet forum was faster then me to identify the star, it's a Mira, V1503 Cyg of spectral type M8. The horizontal and vertical lines change directions when satellite rotates 90 degree every three months. It must do that to have the solar panels directed towards the Sun. |
| More to know : |
Wikipedia: https://en.wikipedia.org/ wiki/Kepler (spacecraft) https://en.wikipedia.org/ wiki/ Variable star V1503 Cyg: http://simbad.u-strasbg.fr |
Differential Photometry of variable star V1503 Cyg |

|
| Image process tool : | AstroImageJ, Irfanview |
| Processing : | Multi aperture analyze |
| Site : | Space |
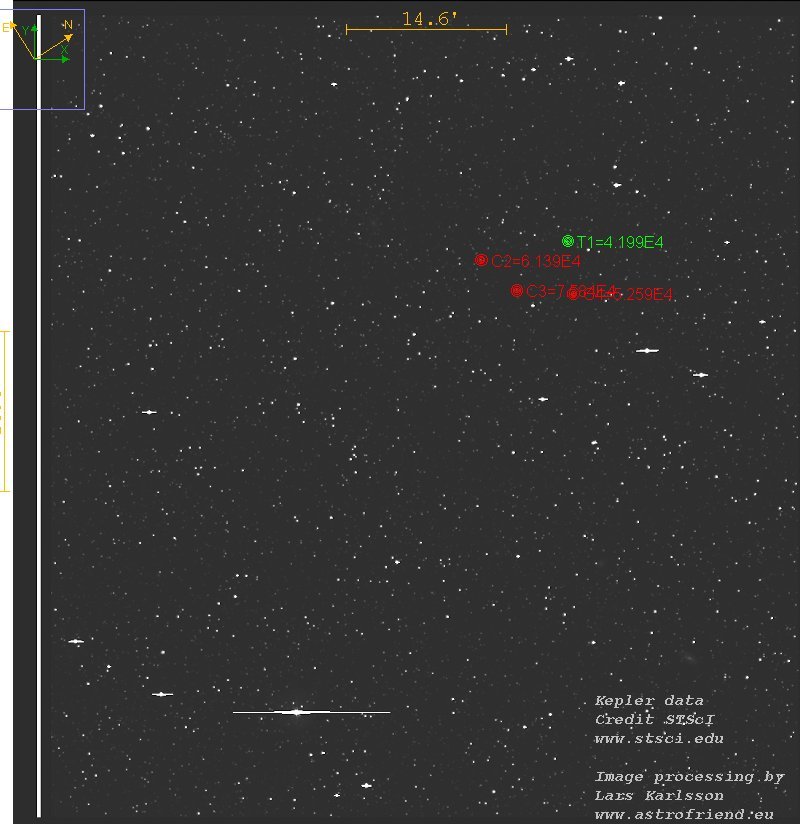
| Comment : | In this image you can se how I have chosen the star T1 to analyze and that is the above variable star V1503 Cyg. By comparing it's light variation over the months relative stable stars, here labeled C2, C3 and C4 I can do differential photometry. |
| More to know : |
Photometry (astronomy): https://en.wikipedia.org/ wiki/ Photometry (astronomy) Hans Bengtsson, discovery information: http://www.konkoly.hu/ cgi-bin/ IBVSpdf?1999 (PDF) |
Light curve of variable star V1503 Cyg |

|
| Image process tool : | AstroImageJ, Irfanview |
| Processing : | Multi aperture analyze |
| Site : | Space |
| Comment : |
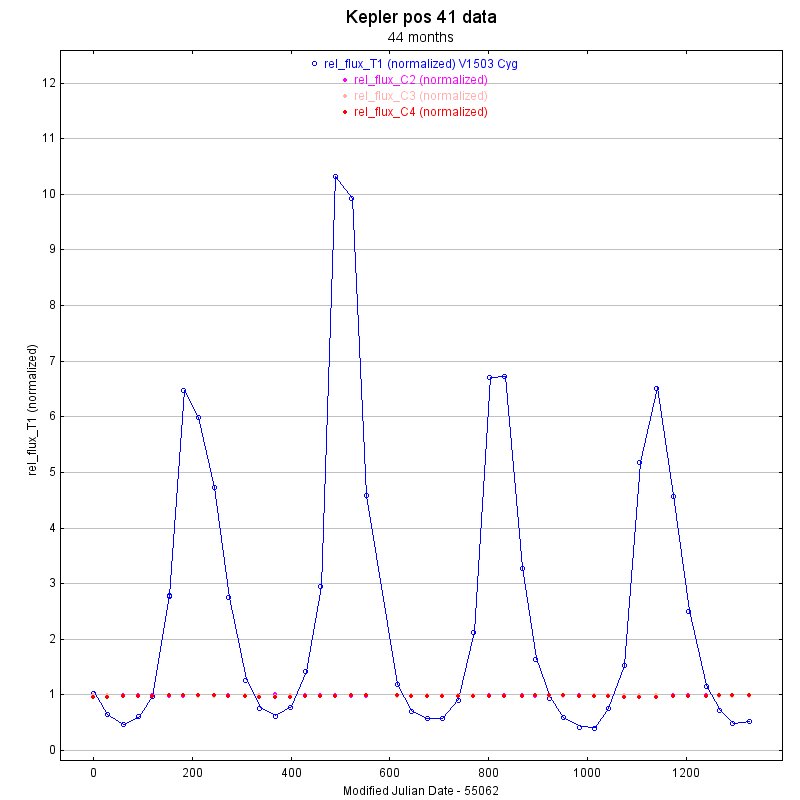
Here is the light curve from above plotted,
it had been better if I had a data point every week, not month.
But I can't ask NASA to reprogram the Kepler space craft for me. The Y-axis is normalized and just relative, the original data are number of detected electrons. It can easily be recalculated to magnitudes if I have the magnitude of the reference stars. The X-axis is in Modified Julian Date time. One month for every dot. |
| More to know : |
Modified Julian Date: http://tycho.usno.navy.mil/ mjd.html |
|
| Go Back |