|
Advertisement / Annons: |
Astronomy Science data |
Content: |
IV, Histogram of velocity from star data:Preparing the data set for velocity histogram:I use the same data set as I used for the HR-diagram but added two columns and deleted one.
This data's purpose is to see if the velocities makes groups for different angles or if they are totally random. They are chosen to be in the neighbour of our Sun. A parallax of 0.05 arcsec is the same as a distance of 20 parsec or 65 Ly (Light years). These data include 703 stars or maybe some other objects. Gaia archive:Below is the page / link to start from: This time I plan to use Octave to calculate the data. Octave set other demand on the data. No fields can be empty and only numbers in the fields. You find more information on page III at bottom of HM-Diagram. 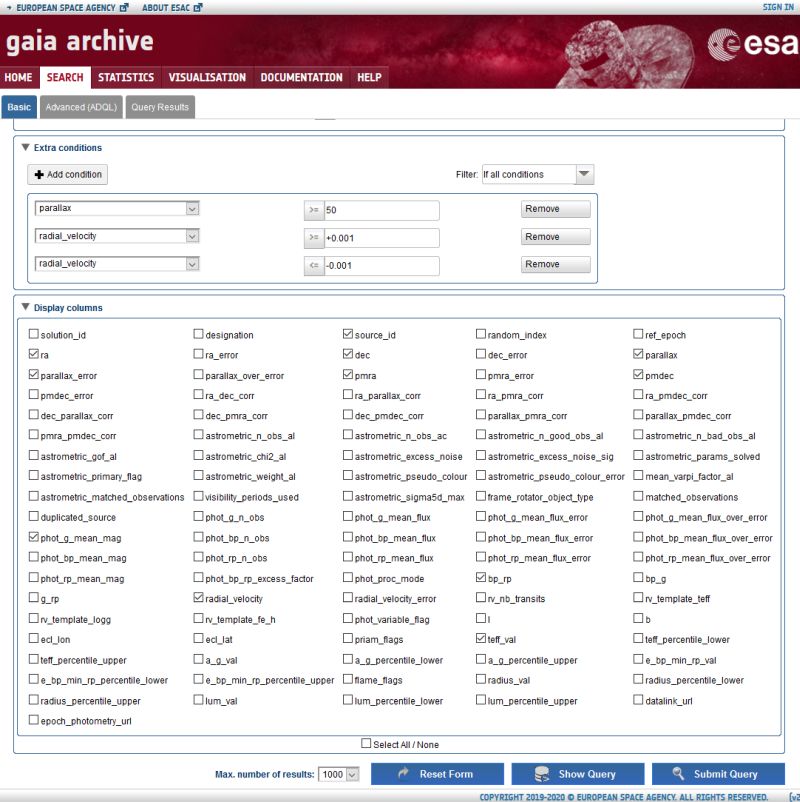
I deleted the a_g_val which for some stars were empty. Added the pmra and pmdec, they are the stars proper motion in milli arcsec. Click on the "Show Query" button and set up the query as before. In this case the numbers of result is 703, you have to increase the max number of result from 500 to 1000. 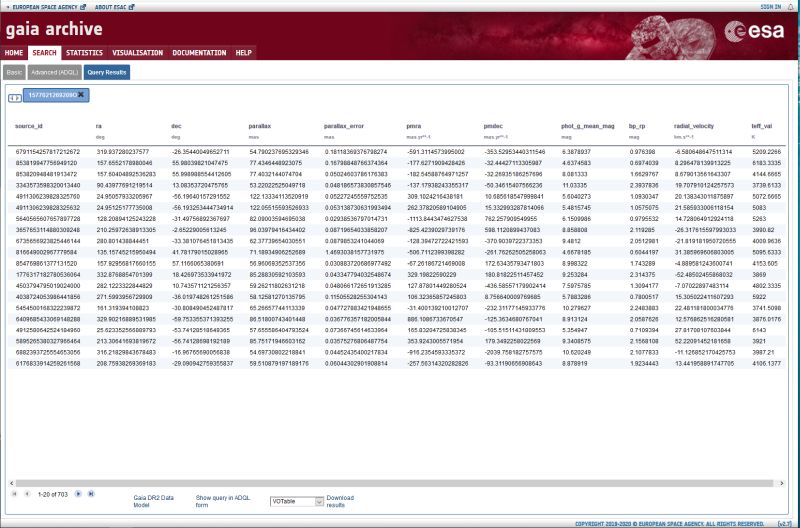
Check through the data that there are no empty fields. If it's ok, download as CSV format. 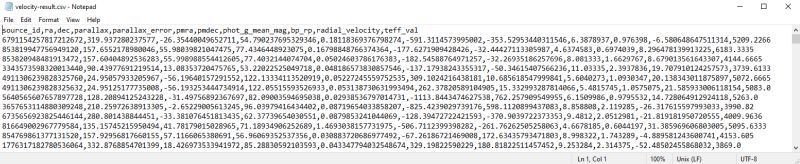
The first row contain non numbers data. That must be deleted (and save somewhere else) before open the data in Octave. If the file is not too large it can be opened in Notepad, otherwise use WordPad or similar that can handle bigger files. 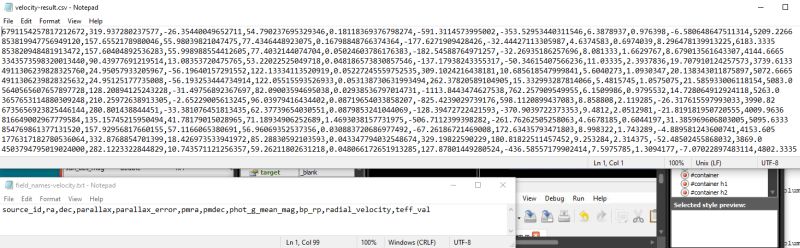
Save the two new files, one with which only contains numbers in the fields and the other with the deleted column names. Now the raw data from Gaia is ready to open in Octave. |
Octave absolute velocities of the nearest stars:The first macro I wrote is to calculate the absolute velocities of the nearest stars, 703 of them. 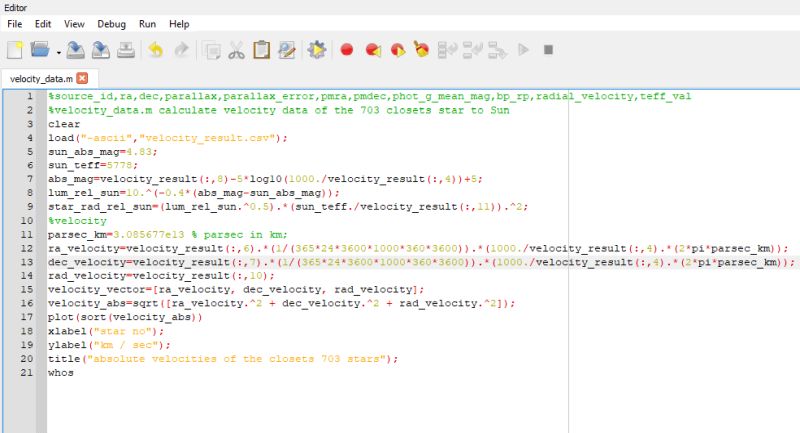
This is how I wrote the macro, at top the column names. Update with explanation of the macro equation, I also corrected the equation and now the velocities are more close to what they shall be.
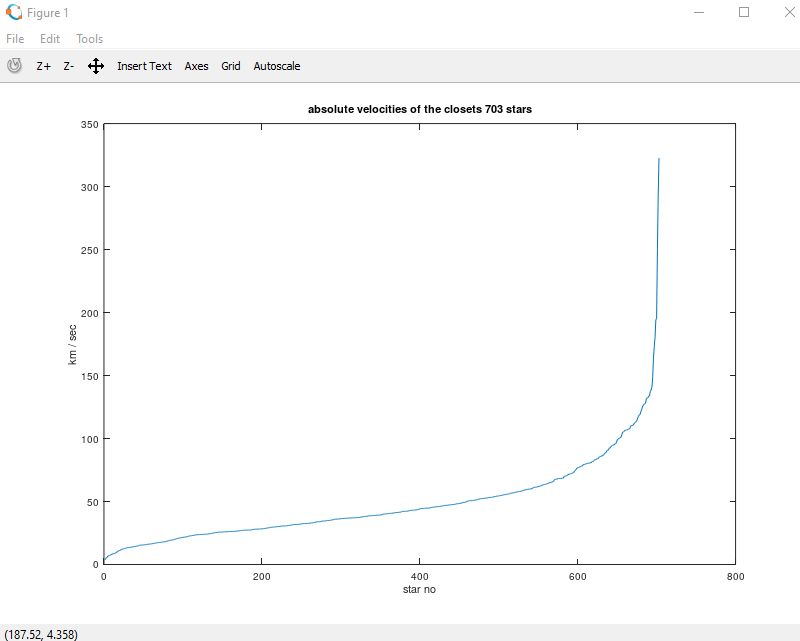
A simple plot of the absolute velocities of the nearest 703 stars to our Sun. They are sorted by velocity and as you see to the right they have very high velocities. The other to the left are more related to our Sun's group of stars. Our Sun's velocity in its orbit around Milky Way galaxy center is 200 km / sec. All these velocities are related to our Sun as if it stands still in the center, i.e. our Sun's velocity = 0 km / sec. It looks as if the 600 nearest stars follow our Sun. I will continue with more analyzes later, it just take some time to figure out how to do everything. High velocity stars can be runaway stars. You find more information about runaway stars at Wikipedia:
|
Octave histogram of velocities of the nearest stars: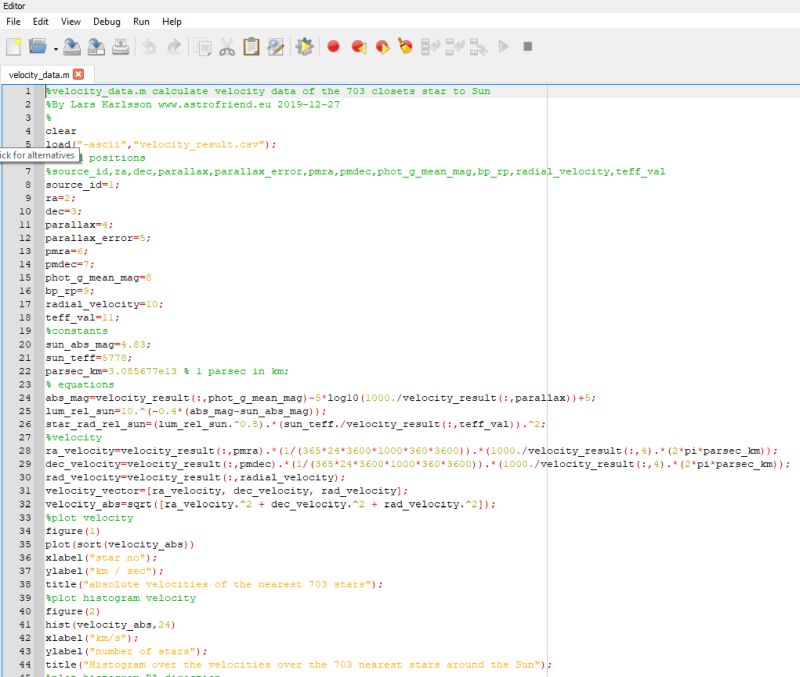
I have changed a bit in the macro to make it more flexible. The fields in the beginning has got a position number.
The absolute velocity is used as in the above example. 24 is a parameter for the class width. It have divided the data in 24 equal widths. 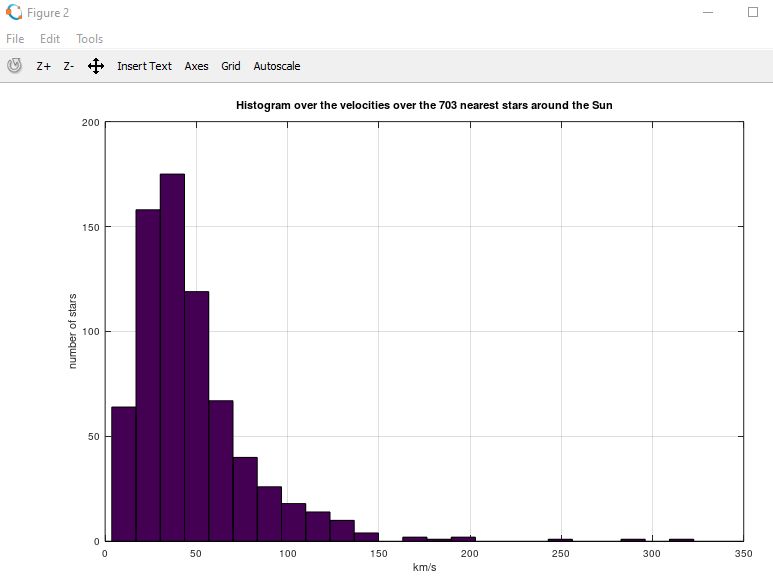
This graph shows how many stars in each group of velocities there are. The velocity range 28 km/s to 42 km/s has most stars. The Sun's orbital speed around the galaxy is 200 km/s. All nearby stars also moves by this speed plus the speed above. If we also can include the direction or the velocity vector we can get more interesting information, come to that later. You find more information about histogram and Sun at Wikipedia:
|
Some useful links with information:
One limitation in Gaia data is that no bright stars are included. Gaia is optimized to detect weak stars and all star visible to the naked eye over saturate the CCD sensor and not usable. |
|
Credit:
Gaia Collaboration et al. (2016): Description of the Gaia mission (spacecraft, instruments, survey and measurement principles, and operations). |
| Go Back to content |
| Go Back |